
Learn how diagrams and visual aids can improve learning, memory, and understanding. Discover practical techniques, benefits, and tips for students to study smarter and retain information effectively.
Have you ever spent hours reading a chapter only to realize that you remember very little the next day? If yes, you are not alone. Many students struggle to retain information when they rely only on reading and memorization. This is where diagrams and visual aids can make a huge difference.
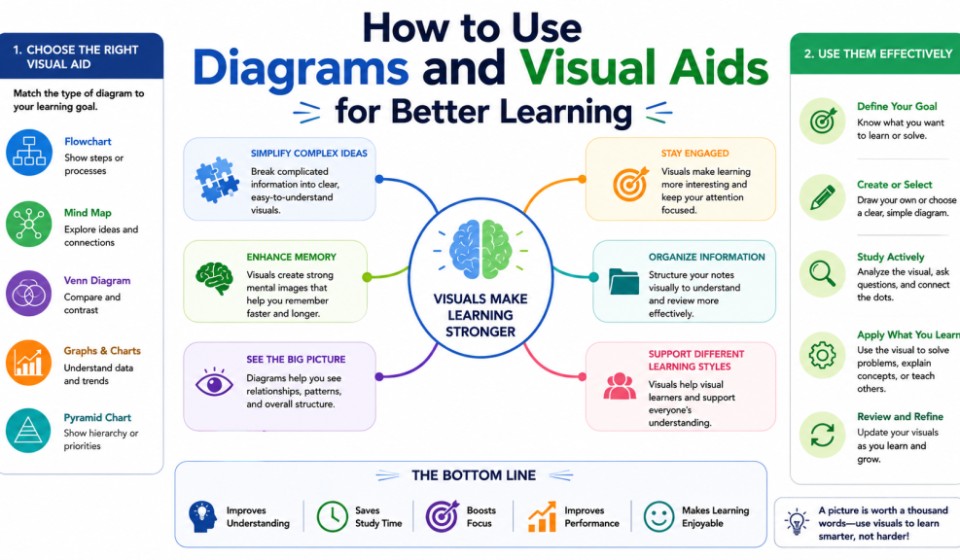
Visual learning is one of the most effective ways to understand and remember information. Instead of reading long paragraphs repeatedly, students can use diagrams, charts, mind maps, and other visual tools to simplify complex topics. These tools help the brain process information faster and make learning more engaging.
Whether you are studying for board exams, preparing for competitive exams, or learning a new skill, diagrams and visual aids can help you learn smarter rather than harder. In this guide, we will explore how visual learning works, why it is effective, and how students can use diagrams and visual aids to improve their academic performance.
What Are Diagrams and Visual Aids?
Diagrams and visual aids are graphical representations of information that help explain concepts, relationships, processes, and ideas. Instead of presenting information through text alone, they use images, symbols, colors, shapes, and structures to make learning easier.
Some common examples include:
- Mind maps
- Flowcharts
- Concept maps
- Venn diagrams
- Timelines
- Infographics
- Graphs and charts
- Tables
- Illustrations and sketches
These visual tools transform complicated information into a format that is easier to understand and remember.
Why Visual Learning Is Effective
The human brain processes visual information much faster than text. Studies suggest that people remember visual content more effectively because images are easier to recognize and recall.
When students combine visual aids with reading and note-taking, they engage multiple parts of the brain simultaneously. This improves comprehension, concentration, and memory retention.
For example, a biology student learning about the human digestive system may find it easier to understand a labeled diagram than several pages of written explanation. Similarly, a history student can quickly understand historical events through a timeline rather than reading lengthy descriptions.
Benefits of Using Diagrams and Visual Aids
1. Improves Understanding
Complex topics often become easier to understand when presented visually. A flowchart can explain a process step by step, while a concept map can show how different ideas are connected.
2. Enhances Memory Retention
Visual information tends to stay in memory longer. Students often remember diagrams they have drawn or studied even weeks after an exam.
3. Increases Engagement
Colorful and organized visuals make studying more interesting. They reduce boredom and help students stay focused for longer periods.
4. Simplifies Complex Information
Subjects such as science, mathematics, economics, and geography often contain complex concepts. Visual aids break these concepts into manageable pieces.
5. Saves Revision Time
Instead of reviewing entire chapters, students can quickly revise key points using diagrams, charts, and mind maps.
Types of Visual Aids and How to Use Them
Mind Maps
Mind maps are excellent for brainstorming and organizing information around a central topic.
For example, if a student is studying “Climate Change,” the main topic can be placed in the center, while branches can include causes, effects, solutions, and global initiatives.
Mind maps are especially useful for:
- Essay preparation
- Exam revision
- Project planning
- Language learning
Flowcharts
Flowcharts show processes in a step-by-step format.
For instance, students studying the water cycle can use a flowchart to visualize evaporation, condensation, precipitation, and collection.
Flowcharts work well for:
- Scientific processes
- Computer programming
- Business procedures
- Decision-making tasks
Venn Diagrams
Venn diagrams compare similarities and differences between two or more concepts.
For example, students can compare renewable and non-renewable energy sources using overlapping circles that highlight common features and differences.
Timelines
Timelines organize events chronologically.
History students often use timelines to understand significant events, dates, and developments over time.
Infographics
Infographics combine images, icons, statistics, and short text to communicate information effectively.
They are useful for:
- Presentations
- Research projects
- Social studies
- Public awareness topics
Practical Ways to Use Visual Aids While Studying
Create Visual Notes
Instead of writing long notes, convert important information into diagrams and sketches. Use arrows, symbols, and colors to connect ideas.
Summarize Each Chapter
After completing a chapter, create a one-page visual summary using charts, mind maps, or concept diagrams. This makes revision easier before exams.
Use Colors Strategically
Different colors can represent different categories of information. For example:
- Blue for definitions
- Green for examples
- Red for important points
- Yellow for formulas
Color coding improves organization and recall.
Draw Your Own Diagrams
Creating diagrams yourself can be more beneficial than simply looking at them. The process helps reinforce learning and understanding.
Combine Text and Visuals
Visual aids work best when combined with concise explanations. Avoid relying entirely on images without understanding the concepts behind them.
Digital Tools for Creating Visual Aids
Technology has made visual learning more accessible than ever. Students can create professional-looking diagrams using various online tools.
Popular options include:
- Canva
- Google Drawings
- Microsoft PowerPoint
- Lucidchart
- MindMeister
- Miro
- Coggle
These tools offer templates that make creating visual content simple, even for beginners.
Real-Life Example of Visual Learning
Consider a Class 12 student preparing for board exams. Reading an entire chapter on photosynthesis may feel overwhelming. Instead, the student creates a diagram showing sunlight, carbon dioxide, water, chlorophyll, glucose, and oxygen.
Whenever the student revises, the diagram provides a quick overview of the entire process. This approach saves time and improves understanding.
Similarly, students preparing for competitive exams like NEET, JEE, UPSC, or SSC often use mind maps and flowcharts to revise large amounts of information efficiently.
Common Mistakes to Avoid
While visual aids are helpful, students should avoid these common mistakes:
Overloading Information
Too much information can make a diagram confusing. Keep visuals clear and focused.
Using Excessive Colors
Colors should improve understanding, not create distractions.
Ignoring Accuracy
Incorrect diagrams can lead to misunderstandings and poor exam performance.
Relying Only on Visuals
Visual aids should support learning, not replace reading and practice.
Making Complicated Designs
Simple diagrams are often more effective than overly decorative ones.
Tips for Maximum Learning Benefits
- Review visual notes regularly.
- Use visuals during group study sessions.
- Create diagrams immediately after learning a topic.
- Use real-world examples whenever possible.
- Keep visual aids organized in a dedicated notebook or folder.
- Update diagrams when you learn new information.
- Practice explaining diagrams aloud to strengthen understanding.
Sources
https://l1nq.com/j3aw8u0
https://l1nq.com/ui2l9qn
Conclusion
Diagrams and visual aids are powerful learning tools that make complex information easier to understand, remember, and apply. Whether you are a school student, college learner, or preparing for competitive exams, visual learning techniques can significantly improve your study efficiency. From mind maps and flowcharts to infographics and concept diagrams, these tools help organize information logically and reduce confusion.
In today’s digital learning environment, students have access to numerous apps and online platforms that make creating visual aids easier than ever. By combining traditional study methods with visual learning strategies, learners can improve comprehension, boost memory retention, and make studying more engaging. The key is to choose the right type of visual aid for the subject and use it consistently as part of your learning routine.
Frequently Asked Questions (FAQs)
1. Why are diagrams important in learning?
Diagrams simplify complex concepts by presenting information visually, making them easier to understand and remember.
2. Which types of diagrams are most useful for students?
Mind maps, flowcharts, concept maps, Venn diagrams, timelines, and infographics are among the most effective visual learning tools.
3. Can visual aids improve memory retention?
Yes. Visual information is processed more efficiently by the brain and is often remembered longer than text alone.
4. Are visual aids useful for all subjects?
Yes. They can help students learn science, mathematics, history, geography, business studies, and languages more effectively.
5. What tools can students use to create visual aids?
Students can use Canva, Lucidchart, MindMeister, Google Drawings, Microsoft PowerPoint, and Miro to create professional visual learning materials.